INTRODUCTION
Contrast-enhanced magnetic resonance imaging (MRI) is a cornerstone in the diagnostic evaluation of brain neoplasms. However, differentiating between high-grade gliomas (HGGs), brain metastases (BM), and primary central nervous system lymphomas (PCNSL) can be challenging due to overlapping imaging characteristics. These three entities are the most common high-grade brain malignancies in adults, and while advanced MR sequences like diffusion-weighted and perfusion imaging offer valuable insights, diagnostic ambiguity persists in a significant subset of cases. Accurate preoperative diagnosis is paramount as treatment strategies and prognoses for these conditions diverge substantially. Therefore, a non-invasive modality capable of reliably distinguishing between these lesions is critically needed.
18F-fluoroethyl-tyrosine (FET) positron emission tomography (PET) emerges as a promising tool in this context. FET is an amino acid tracer that is transported into cells via L-amino acid transporters (LATs). Crucially, LAT expression is elevated in proliferating glial cells, correlating with glioma grade. Consequently, FET-PET has become a recognized standard for distinguishing between high-grade and low-grade glial tumors. Given the distinct management pathways for HGGs, BM, and PCNSL, FET-PET’s potential to specifically identify glial tumors using semi-quantitative parameters warrants investigation. This study was designed to establish reliable cutoff values for FET-PET imaging by comparing imaging findings with definitive histopathological diagnoses, aiming to improve the differentiation of high-grade brain lesions.
MATERIALS AND METHODS
Patients
This retrospective study included 27 patients (detailed in Table 1) who presented with high-grade brain lesions on index MRI between October 2016 and October 2017. These lesions, categorized as Grade III and IV tumors according to the 2016 WHO classification of central nervous system (CNS) tumors, exhibited overlapping MRI features suggestive of HGG and metastases, HGG and PCNSL, or a combination of all three. Two expert neuroradiologists from our institution’s Multidisciplinary Neuro-Oncology Joint Clinic confirmed the diagnostic ambiguity and recommended FET-PET imaging. All patients underwent FET-PET prior to any therapeutic interventions that could alter 18F-FET uptake, such as surgery, biopsy, chemoradiotherapy, or radiosurgery. Furthermore, definitive neuropathological diagnosis was obtained through stereotactic biopsy or open resection within 6 weeks of MR and PET imaging. The Institutional Review Board and Ethics Committee of our institution approved this study (Hospital IRB No – 3075).
Table 1. Patient Characteristics (G-Glioma, M-Metastases, L- Lymphoma)
| Patient No | Age/Sex | Differentials on MR | T/Wm (5 min) | T/Wm (20 min) | Histopathology |
|---|---|---|---|---|---|
| 1 | 55/M | G/M | 2.2 | 2.3 | Grade IV, Glioblastoma |
| 2 | 58/M | G/L/M | 2.04 | 2.2 | Grade IV, Glioblastoma |
| 3 | 55/F | G/L | 2.6 | 2.2 | Grade IV, Glioblastoma |
| 4 | 38/F | G/L | 2 | 2.2 | Grade IV, Glioblastoma |
| 5 | 21/F | G/L | 1.2 | 1.1 | Tuberculoma |
| 6 | 62/M | G/M | 1.8 | 1.1 | Grade IV, Glioblastoma |
| 7 | 54/M | G/L/M | 1.6 | 1.6 | Metastases |
| 8 | 86/M | G/L | 2.6 | 2.6 | Grade IV, Glioblastoma |
| 9 | 62/M | G/L | 2.8 | 2.6 | Grade IV, Glioblastoma |
| 10 | 57/M | G/L/M | 2.7 | 2.6 | Grade IV, Glioblastoma |
| 11 | 43/F | G/M | 1.5 | 1.6 | Metastases |
| 12 | 78/M | G/L/M | 2.4 | 2.5 | Grade IV, Glioblastoma |
| 13 | 67/F | G/L | 1.3 | 1.4 | PCNSL |
| 14 | 35/M | G/L | 1.8 | 1.6 | Metastases |
| 15 | 42/F | G/L/M | 1.4 | 1.6 | Grade III, Anaplastic meningioma |
| 16 | 56/M | G/L/M | 2.3 | 2.5 | Grade IV, Glioblastoma |
| 17 | 72/M | G/L/M | 2.6 | 2.4 | Grade IV, Glioblastoma |
| 18 | 50/F | G/L/M | 2.1 | 2.2 | Grade IV, Glioblastoma |
| 19 | 28/F | G/L/M | 1.5 | 1.7 | PCNSL |
| 20 | 34/M | G/L/M | 1.6 | 1.6 | Tuberculoma |
| 21 | 81/M | G/M | 2.4 | 2.5 | Grade IV, Glioblastoma |
| 22 | 64/M | G/L | 2.1 | 2.5 | Grade IV, Glioblastoma |
| 23 | 56/M | G/M | 2.1 | 2.0 | Metastases |
| 24 | 48/F | G/L | 1.6 | 1.8 | PCNSL |
| 25 | 45/M | G/L/M | 2.8 | 2.7 | Grade IV, Glioblastoma |
| 26 | 72/M | G/L/M | 1.2 | 1.5 | Metastases |
| 27 | 65/F | G/M | 2.4 | 2.4 | Grade IV, Glioblastoma |
![Patient 7 is a 54-year-old male, presented with progressive bilateral diminution of vision and right hemiparesis for 2 months, MRI showed (a) T2-hypointense lesion in the left occipital region, with perilesional edema. (b) Axial postcontrast T1-weighted image showed homogeneous enhancement. MR spectroscopy and perfusion were noncontributory. Differentials were high-grade glioma, PCNSL with rare possibility of metastases. FET-PET was done (c), which showed low-grade uptake in the lesion with a tumor-to-contralateral white mater (T/Wm) ratio of 1.6 at 5 and 20 min. Patient was not willing for biopsy; hence, whole-body FDG PET was done which showed rim of increased uptake in the brain lesion ([d] equal to gray matter), and primary site in the anal canal, seen on maximum intensity projection (MIP) image ([e] – arrow), biopsy showed anal melanoma, thus brain lesion was most likely metastatic. FET-PET (T/Wm) ratio was useful in ruling out high-grade glioma](https://pets.edu.vn/wp-content/uploads/2025/02/wjnm-18-266-g004.jpg)
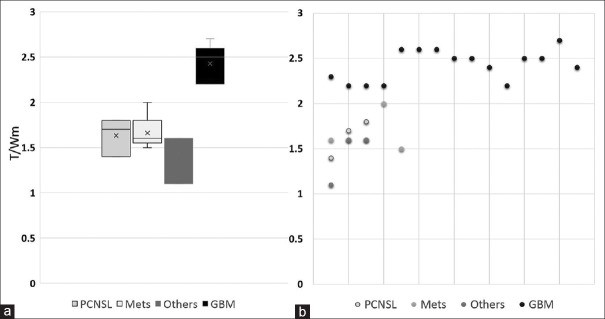
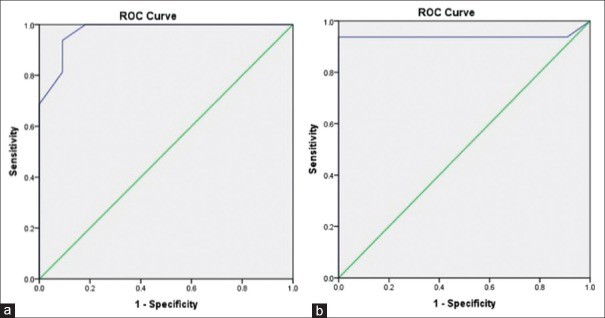
Table 2. MR imaging features (G-Glioma, M-Metastases, L- Lymphoma)
| Patient No | MR diagnosis | Location | T2 intensity | Post Contrast | Spectroscopy | Perfusion |
|---|---|---|---|---|---|---|
| 1 | G/M | Left temporal | Hypo | Enhancing | Choline Peak | Hypoperfused |
| 2 | G/L/M | Peri-ventricular | Hypo | Enhancing | Choline Peak | Hyperperfused |
| 3 | G/L | Left insular | Hyper | Ring-enhancing | Choline peak | Hyperperfused |
| 4 | G/L | Peri-ventricular | Hypo | Enhancing | Choline peak | Hypoperfused |
| 5 | G/L | Grey-white interface | Central Hypo | Ring-enhancing | Non-contributory | Mild hyperperfusion |
| 6 | G/M | Midline pericallosal | Iso- | Enhancing | Choline Peak | Hypoperfused |
| 7 | G/L/M | Right frontal | Iso | Ring-enhancing | Non-contributory | Hyperperfused |
| 8 | G/L | Right frontal | Hypo | Ring-enhancing | Non-contributory | Hyperperfused |
| 9 | G/L | Periventricular | Iso to hyper | Ring-enhancing | Choline peak | Mild hyperperfusion |
| 10 | G/L/M | Left medial temporal | Hypo | Enhancing | Choline peak | Hypoperfused |
| 11 | G/M | Right parietal | Hypo | Ring-enhancing | Non-contributory | Hyperperfused |
| 12 | G/L/M | Left parieto-temporal | Iso | Ring-enhancing | Non-contributory | Hyperperfused |
| 13 | G/L | Peri-ventricular | Hypo | Enhancing | Choline peak | Hypoperfused |
| 14 | G/L | Left Temporal | Hypo | Ring-enhancing | Non-contributory | Hyperperfused |
| 15 | G/L/M | Left frontal | Iso to hyper | Enhancing | Non-contributory | Hyperperfused |
| 16 | G/L/M | Left temporal | Hypo | Enhancing | Choline Peak | Hypoperfused |
| 17 | G/L/M | Right insular | Hypo | Enhancing | Non-contributory | Hypoperfused |
| 18 | G/L/M | Left frontal | Hypo | Ring-enhancing | Non-contributory | Hypoperfused |
| 19 | G/L/M | Periventricular | Iso to hyper | Ring-enhancing | Choline peak | Hyperperfused |
| 20 | G/L/M | Left Temporal | Hypo | Ring-enhancing | Non-contributory | Hyperperfused |
| 21 | G/M | Peri-ventricular | Hypo | Enhancing | Choline peak | Hypoperfused |
| 22 | G/L | Left insular | Hyper | Ring-enhancing | Non-contributory | Hyperperfused |
| 23 | G/M | Right parietal | Hypo | Ring-enhancing | Non-contributory | Hyperperfused |
| 24 | G/L | Periventricular | Iso | Ring-enhancing | Choline peak | hyperperfused |
| 25 | G/L/M | Right frontal | Iso to hyper | Ring-enhancing | Non-contributory | Hypoperfused |
| 26 | G/L/M | Left frontal | Hypo | Ring-enhancing | Non-contributory | Hyperperfused |
| 27 | G/M | Right temporal | Iso | Ring-enhancing | Choline Peak | Hypoperfused |
Iso- Iso-intense, Hypo-hypointense, hyper-hyperintense
Positron-emission tomography imaging
18F-FET radiotracer was produced at our in-house medical cyclotron facility. PET scans were performed following intravenous administration of 222–296 MBq of 18F-FET, utilizing dedicated PET/computed tomography (CT) scanners (Philips Astonish Time-of-Flight systems) equipped with 16-slice and 64-slice CT components, respectively. Static image acquisition was employed, capturing limited field-of-view brain images at 5 minutes and 20 minutes post-injection, with each acquisition lasting 5 minutes.
Image processing
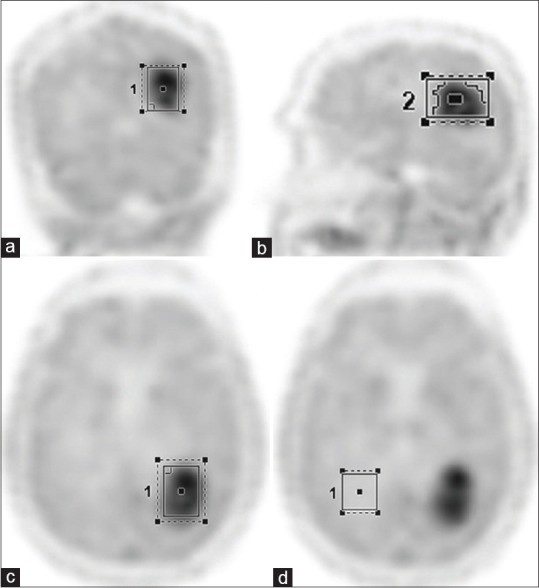
A nuclear medicine physician, blinded to patient clinical history and MRI findings, processed and interpreted the PET images. The semi-quantitative parameter used for image analysis was the tumor-to-contralateral white matter ratio (T/Wm). For each patient, transaxial slices exhibiting the highest 18F-FET uptake within the tumor were selected for region of interest (ROI) analysis. The nuclear medicine physician delineated three-dimensional volumetric ROIs across axial, coronal, and sagittal planes (Figure 1). The maximum standardized uptake value (SUVmax) within the tumor ROI was recorded. A separate ROI was placed over the contralateral white matter on three consecutive slices, and the average SUVmax from these measurements was taken as the SUVmax of the contralateral white matter. The T/Wm ratio was then calculated by dividing the tumor SUVmax by the contralateral white matter SUVmax. All primary brain lesions underwent surgical biopsy or resection for histopathological confirmation. Receiver operating characteristic (ROC) curve analysis was performed to determine the optimal T/Wm cutoff value for differentiating glial tumors from other pathologies.
Figure 1. Region of interest analysis in FET-PET imaging.
Region of interest generated over coronal (a), sagittal (b), and axial (c) FET-PET images. Background region of interest drawn over contralateral white mater (d) on axial PET image. Alt text: FET-PET imaging ROI analysis showing tumor delineation in coronal, sagittal, and axial views, and contralateral white matter ROI for background reference. Keywords: FET-PET, ROI analysis, brain imaging, tumor delineation, contralateral white matter.
RESULTS
Table 1 summarizes the demographic data, MRI findings, FET-PET results, and histopathological diagnoses for all 27 patients. The study cohort comprised 17 males and 10 females, with a median age of 56 years (range: 21–86 years). Based on MRI interpretations, the initial radiological differential diagnoses included HGG and PCNSL in nine patients (Figures 2 and 3), HGG and metastases in five patients (Figure 4), and HGG, PCNSL, and metastases in 13 patients (Figure 5). Histopathological examination ultimately revealed HGG in 16 patients, metastases in five, and PCNSL in three. Two patients were diagnosed with tuberculoma, and one with anaplastic meningioma.
PCNSL lesions exhibited low T/Wm ratios, with a mean of 1.46 at 5 minutes and 1.63 at 20 minutes. Similarly, metastases also showed low T/Wm ratios, with mean values of 1.64 and 1.66 at 5 and 20 minutes, respectively. The patients with tuberculoma (mean T/Wm 1.4 and 1.35 at 5 and 20 minutes) and anaplastic meningioma (T/Wm – 1.4 and 1.6 at 5 and 20 minutes) also presented with low T/Wm ratios. In contrast, HGGs, all of which were confirmed as Grade IV glioblastoma on histopathology, demonstrated comparatively higher T/Wm ratios, with mean values of 2.36 and 2.33 at 5 and 20 minutes, respectively. Collectively, high-grade non-glial tumors showed a significantly lower mean T/Wm of 1.52 at 5 minutes and 1.59 at 20 minutes compared to high-grade glial tumors (Figure 6).
A T/Wm cutoff value of 1.9 at both 5 and 20 minutes demonstrated a sensitivity of 93.8% (Figure 7) and a specificity of 91% for diagnosing HGGs (5 min – area under the ROC curve (AUC) = 0.974, P = 0.00; 20 min AUC = 0.940, P = 0.00).
Figure 2. FET-PET and MRI of Glioblastoma mimicking PCNSL.
Patient 3: 55-year-old female with glioblastoma. Axial MRI showing left lateral ventricle mass, T2 hypointense, contrast-enhancing, restricted diffusion. FET-PET shows high tracer uptake. Alt text: Glioblastoma vs PCNSL differentiation using FET-PET. MRI and FET-PET images of a glioblastoma case initially suspected as PCNSL, highlighting the diagnostic challenge and the role of FET-PET. Keywords: Glioblastoma, PCNSL, FET-PET, differential diagnosis, brain tumor imaging.
Figure 3. FET-PET and MRI of Glioblastoma in an elderly patient.
Patient 8: 86-year-old male with glioblastoma. MRI showing corpus callosal lesion, T1 hypointense, T2 isointense, hyperperfusion. FET-PET shows high T/Wm ratio. Alt text: FET-PET diagnosis of glioblastoma in elderly patient. MRI and FET-PET images illustrating the use of FET-PET to diagnose glioblastoma in an elderly patient with complex presentation. Keywords: Glioblastoma, elderly, FET-PET, brain tumor diagnosis, corpus callosum lesion.
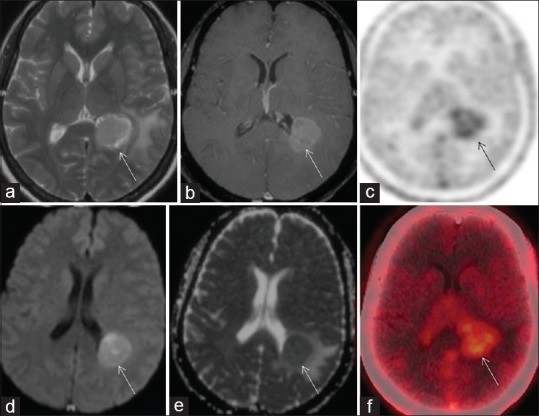
Figure 4. FET-PET and MRI of Metastatic Melanoma mimicking Glioblastoma.
Patient 7: 54-year-old male with metastatic melanoma. MRI showing occipital lesion, T2 hypointense, contrast-enhancing. FET-PET shows low T/Wm ratio, FDG-PET reveals primary anal melanoma. Alt text: Differentiating metastasis from glioma using FET-PET. MRI and FET-PET images of a metastatic melanoma case initially mimicking glioma, demonstrating FET-PET’s utility in distinguishing non-glial lesions. Keywords: Metastasis, melanoma, glioblastoma mimic, FET-PET, FDG-PET, brain tumor differentiation.
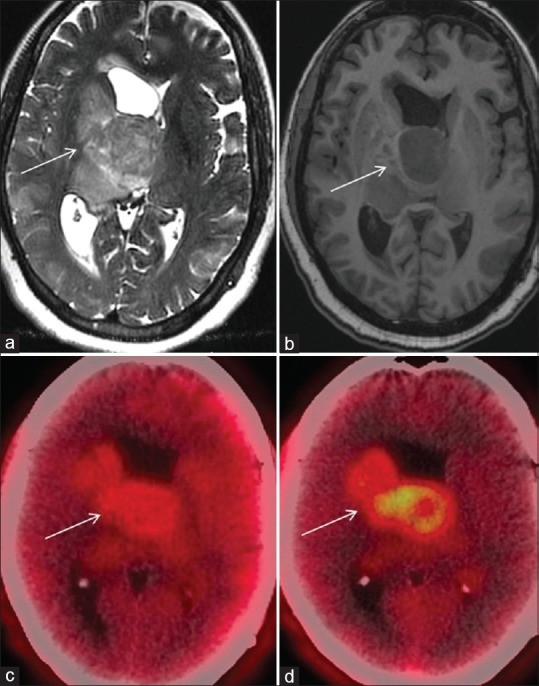
Figure 5. FET-PET and MRI of Glioblastoma mimicking Metastases or Lymphoma.
Patient 12: 78-year-old male with glioblastoma. MRI showing left parietal lesion, T2 hyperintense, minimal contrast enhancement, restricted diffusion, hyperperfusion. FET-PET shows high tracer uptake. Alt text: FET-PET for glioblastoma diagnosis in complex cases. MRI and FET-PET images of a glioblastoma case with overlapping features of metastases and lymphoma, highlighting FET-PET’s role in resolving diagnostic uncertainty. Keywords: Glioblastoma, metastases mimic, lymphoma mimic, FET-PET, complex brain lesions, diagnostic imaging.
Figure 6. Tumor-to-white matter ratio comparison across different brain lesions.
(a) Box plot and (b) dot plot depicting the tumor-to-white matter (T/Wm) ratio across PCNSL, metastases, glioblastoma, and other lesions. Alt text: T/Wm ratio distribution in different brain tumors. Box and dot plots comparing tumor-to-white matter ratios in PCNSL, metastases, glioblastoma, and other brain lesions, illustrating the discriminatory power of FET-PET. Keywords: T/Wm ratio, brain tumors, PCNSL, metastases, glioblastoma, FET-PET quantification.
Figure 7. ROC curve analysis for T/Wm cutoff value.
Area under the curve showing a 1.9 tumor-to-white matter (T/Wm) ratio cutoff to differentiate high-grade glial and non-glial high-grade lesions with a sensitivity of 93.8% and specificity of 91%, at 5 min (a) and 20 min (b). ROC: Receiver operating characteristic. Alt text: ROC curve for FET-PET in brain tumor differentiation. Receiver Operating Characteristic curves demonstrating the accuracy of a T/Wm ratio of 1.9 in differentiating high-grade glial from non-glial brain lesions using FET-PET. Keywords: ROC curve, sensitivity, specificity, FET-PET accuracy, brain tumor diagnosis, T/Wm cutoff.
DISCUSSION
Distinguishing between PCNSL, metastases, and HGGs is a frequent and critical challenge in the management of patients with high-grade intracranial lesions. Accurate differentiation is vital because treatment strategies and prognoses vary significantly among these conditions. This study aimed to evaluate the utility of FET-PET in identifying HGGs when MRI findings were ambiguous, despite the use of advanced imaging sequences. By specifically selecting patients with equivocal MRI results, we focused on the clinical scenario where FET-PET could offer the greatest diagnostic benefit. Our findings demonstrate that a tumor-to-white matter ratio cutoff of 1.9 on FET-PET effectively differentiates between glial and non-glial lesions. The non-glial group in our study included brain metastases, PCNSL, tuberculomas, and an anaplastic meningioma. Among the patients with brain metastases, primary tumor sites were lung, anorectal melanoma, and breast. With a sensitivity of 93% and specificity of 91% for diagnosing HGGs, FET-PET shows significant promise as a valuable tool in this challenging diagnostic setting.
Our findings are contextualized by a meta-analysis by Dunet et al., which reported a maximum tumor-to-background ratio (TBRmax) cutoff of 2.1 for differentiating glial from non-glial tumors. However, their meta-analysis had a lower sensitivity and specificity (71% and 72%, respectively), likely because it included gliomas of all grades. The majority of FET-PET research has focused on its role in glioma grading. While conventional MRI demonstrates comparable accuracy for glioma grading, and advanced MR techniques have shown even higher accuracy and specificity, MRI alone is not always definitive for initial diagnosis, particularly in lesions with overlapping features. Tumor infiltration and contrast enhancement, hallmarks on MRI, are observed across HGGs, PCNSL, and metastases. Diffusion-weighted imaging, reflecting tumor cellularity, can also be non-specific in certain instances. Relative cerebral blood volume (rCBV) from MR perfusion imaging, known for its high sensitivity in distinguishing glioblastoma, metastases, and PCNSLs, suffers from modest specificity (around 64%).
Fluorodeoxyglucose (FDG) PET has also been explored for characterizing high-grade brain lesions. Studies have shown no significant difference in SUVmax values between HGGs and brain metastases using FDG-PET. While an SUVmax cutoff of 15.5 has been reported for PCNSL diagnosis with FDG-PET, achieving reasonable sensitivity and specificity, false positives remain a concern due to the tracer’s limited specificity for lymphoma. The need for a more specific tracer is underscored by the fact that not all lesions are amenable to biopsy, and treatment decisions often rely heavily on imaging-based diagnoses.
Radiolabeled amino acids, such as methionine and FET, offer improved specificity by exhibiting selectively high uptake in proliferating glial tissue while showing low uptake in normal brain parenchyma. FET uptake is directly correlated with key pathological features of HGGs, including tumor cell density, proliferation rate, microvascular density, and neoangiogenesis. Importantly, FET is not incorporated into metabolic pathways, and its uptake is directly proportional to the density of LAT-2 transporters, which are overexpressed on proliferating glial cells but not typically on inflammatory cells or other tumor types. This mechanism contributes to FET’s specificity for HGGs. Furthermore, FET localization is independent of blood–brain barrier integrity, enabling characterization of non-enhancing lesions on MRI. Another advantage of FET-PET over FDG-PET is the minimal impact of steroid administration on FET uptake. Unlike FDG-PET, where corticosteroid use can significantly reduce tracer uptake, steroids do not substantially alter TBR values in FET-PET, making FET-PET less susceptible to confounding factors related to steroid medication.
While dynamic imaging protocols have been proposed in the literature for FET-PET, we opted for a dual-point static acquisition protocol (5 and 20 minutes), based on the work by Albert et al. Peak FET concentration in glial tumors typically occurs around 20 minutes post-injection, with a slight decline thereafter. The 5-minute image acquisition serves to assess tumor perfusion, as HGGs often exhibit an early peak in tracer uptake, although a small subset of highly vascular lesions may overestimate FET uptake in early images. The 20-minute static image acquisition aids in confirming the findings from the 5-minute image and provides a clearer delineation of tumor extent. Moreover, static acquisition improves patient comfort by reducing scan duration and minimizing motion artifacts, which is particularly beneficial in busy PET/CT centers.
Rapp et al. reported a TBRmax cutoff of 2.5 for differentiating gliomas from other brain lesions. However, the clinical utility of this cutoff was less clear, as their study included a broad spectrum of brain lesions, including both high- and low-grade gliomas, resulting in a reduced sensitivity of 57%. The design of PET molecular imaging studies should be driven by specific clinical questions requiring answers. Our study was therefore specifically designed to address a common clinical challenge encountered in neuro-oncology practice at a large tertiary care center: the differentiation of high-grade gliomas from other high-grade brain lesions when MRI findings are inconclusive. Limitations of our study include its retrospective nature and relatively small sample size. However, the promising results warrant a larger, prospective study to validate our findings and establish more robust clinical guidelines.
CONCLUSION
FET-PET demonstrates significant potential as a valuable imaging modality for differentiating high-grade glial tumors from other high-grade brain lesions when MRI findings are equivocal. The T/Wm ratio cutoff of 1.9 identified in this study provides a practical and effective parameter for improving diagnostic accuracy in this challenging clinical scenario.
Financial support and sponsorship
Nil.
Conflicts of interest
There are no conflicts of interest.